Geophysical Experiments
In today’s world we are faced with many problems in which geophysics can play an important role. Some of these are visualized in the following Figure 1 and include: (a) finding resources (minerals, water, hydrocarbons, geothermal energy); (b) environmental problems (contaminants, salt water, UXO, permafrost), (c) geotechnical (tunnels, infrastructure, slope stability); (d) natural hazards (earthquakes, volcanoes, tsunami); (e) subsurface storage (radioactive waste, CO2 sequestration, water).
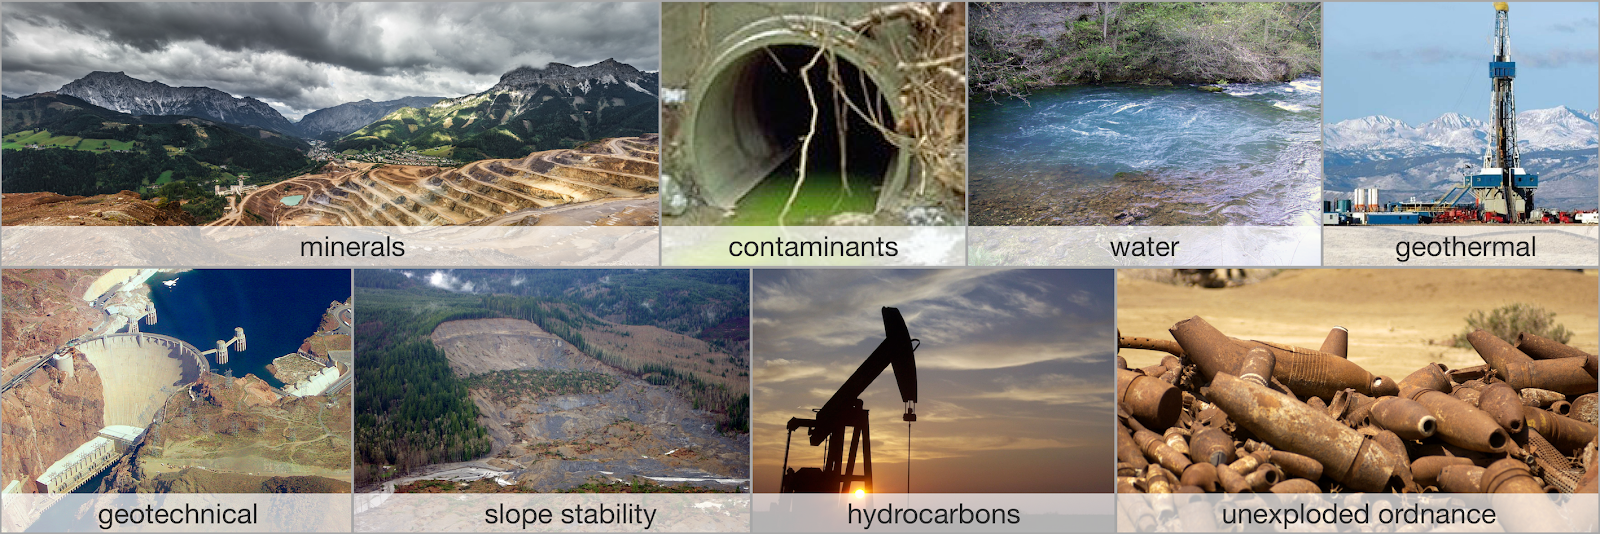
Figure 1:Examples of geophysical experiments: (a) finding resources (minerals, water, hydrocarbons, geothermal energy); (b) environmental problems (contaminants, salt water, UXO, permafrost), (c) geotechnical (tunnels, infrastructure, slope stability); (d) natural hazards (earthquakes, volcanoes, tsunami); (e) subsurface storage (radioactive waste, CO2 sequestration, water).
To address these problems we need to be able to obtain information about the earth without directly sampling the domain. This is precisely the roll that geophysics can fulfill. A typical geophysical experiment is portrayed in Figure 2 below.
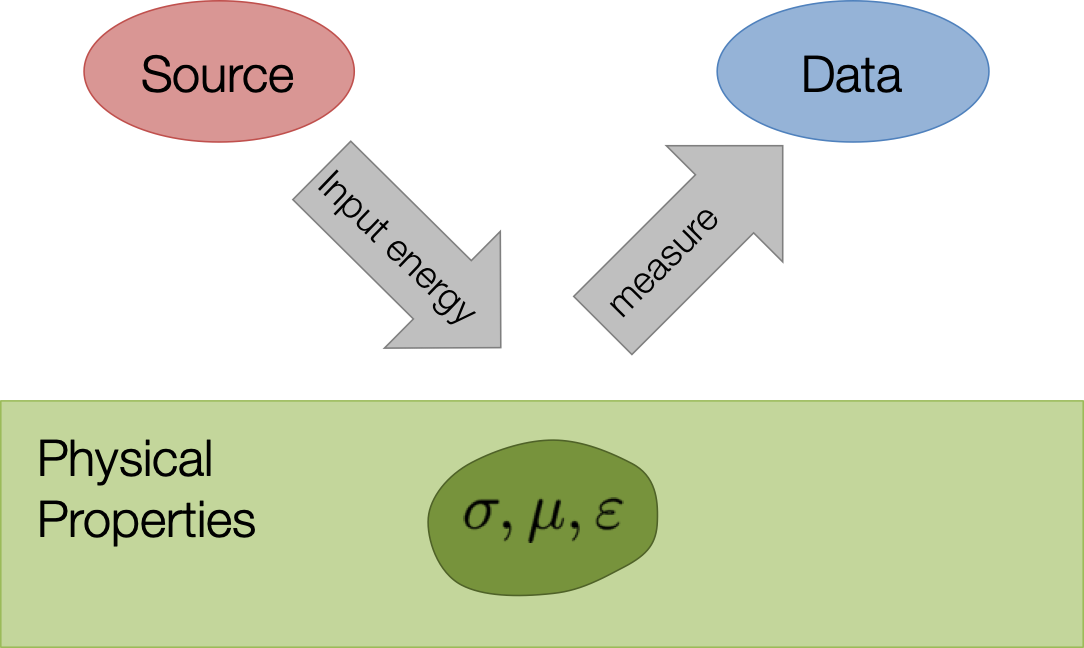
Figure 2:Energy from a source is input to ground and propagates through the earth in a way that is governed by physical properties.
Energy from a source is input to ground and propagates through the earth in a way that is governed by physical equations. The parameters in the governing equations are the physical properties of the earth (e.g. density, susceptibility, electrical conductivity, magnetic permeability, elastic parameters) and the distribution of these parameters determine how the energy flows. Sensors, usually at the surface, record potentials, fields and/or fluxes. These are the “observations” or “data”. In a general geophysical experiment we are given knowledge about the source, the equations governing the physics, and the observations. The goal is to extract information about the earth by recovering the distribution of the physical properties associated with the particular experiment.
In the following we introduce some of the experiments we shall be working with.
1Cross-well Tomography
The physical property of interest is the seismic velocity or its reciprocal, slowness
Transmitters (Tx) in a borehole produce an acoustic signal which is measured by receivers (Rx) in another borehole. The governing equations are those used in seismology and involve density and the elastic constants. Here we simplify the physical problem and assume energy travels in straight rays. A value of a datum will be the time it takes for a seismic pulse to travel from a Tx to a Rx. Data can be plotted as a 2D image.
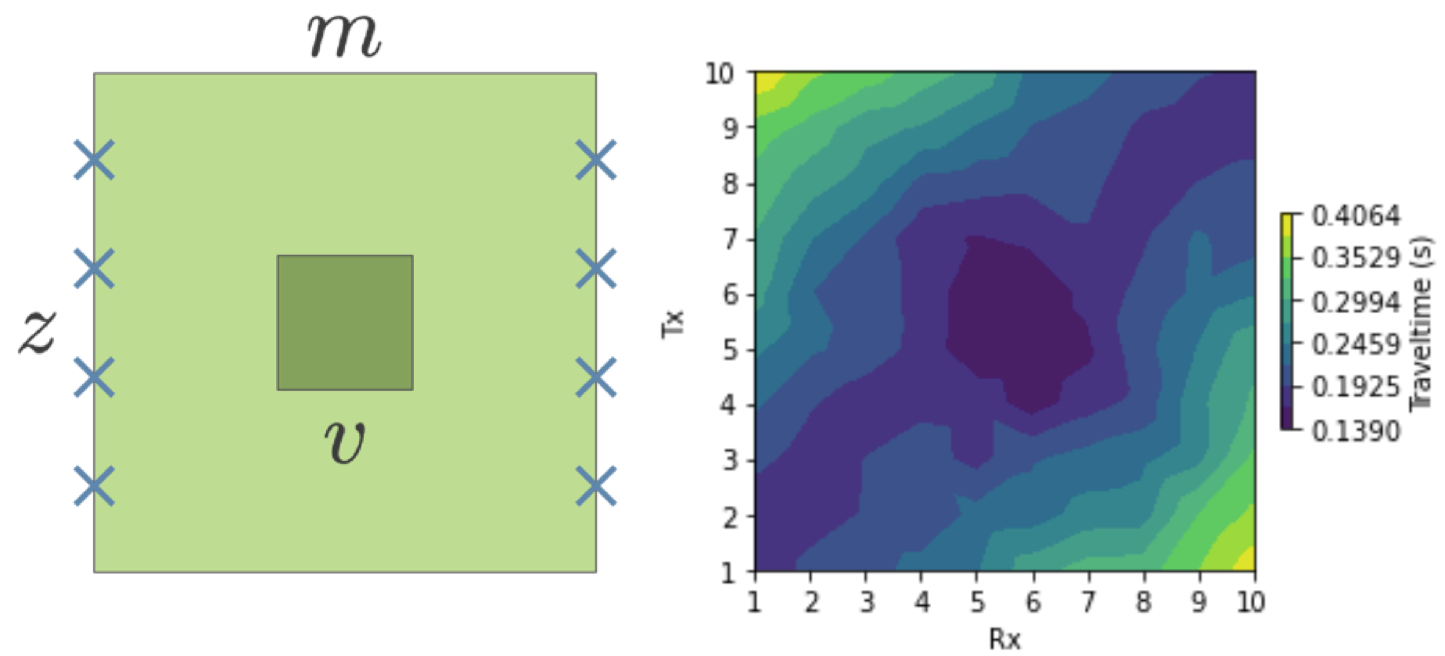
Figure 3:Cross-well tomography
2Direct Current (DC) Resistivity
The physical property is electrical conductivity σ or its reciprocal, resistivity
Current is input to the earth using a generator and two electrodes and the electric potential difference is measured between two other electrodes. The data are converted to an apparent resistivity and plotted as a pseudo-section.
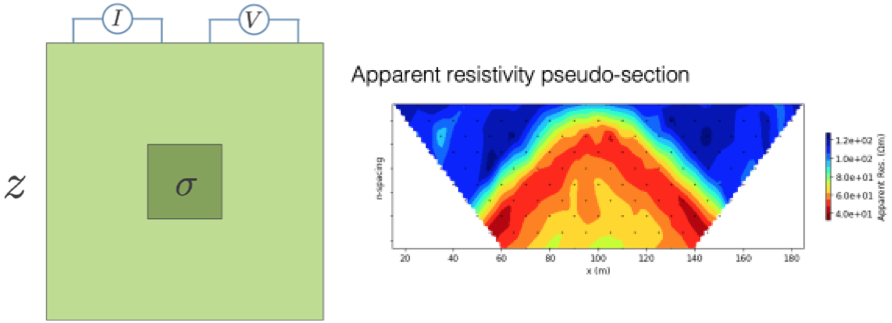
Figure 4:Direct Current Resistivity
3Airborne Time-Domain EM
The physical property is the electrical conductivity. The transmitter is a large loop of wire in which a current is flowing. In its simplest form, a steady-state current is turned off and a receiver, usually mounted beneath the aircraft, measures the resultant magnetic field or its time derivative. Data can be plotted as individual decays for a transmitter or in plan-view for a particular time channel.
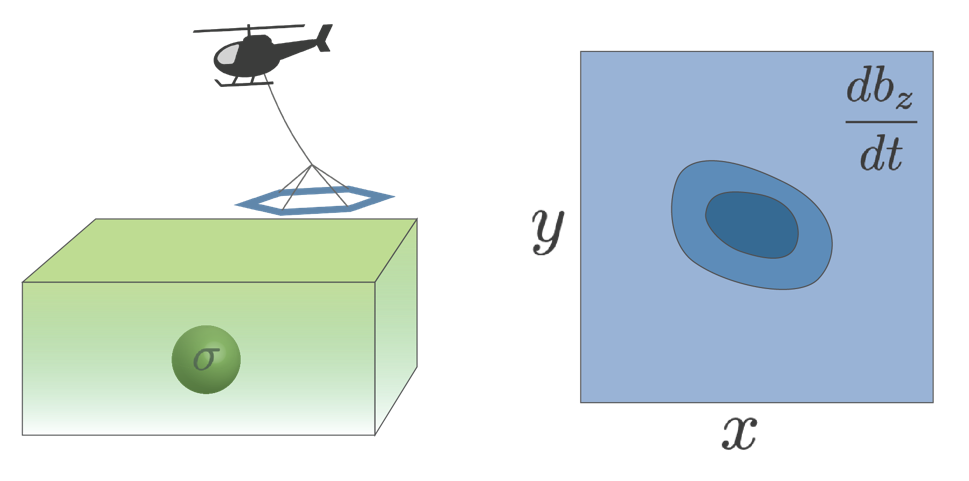
Figure 5:Airborne Time-Domain EM
4Magnetics
The physical property is magnetic susceptibility κ. This is related to magnetic permeability through the equation
The source is the earth’s magnetic field. This magnetizes earth materials and their resultant magnetic field can be measured with a magnetometer. The sensor can be on the surface of the earth or carried by various aircraft. The data are generally plotted in map form.
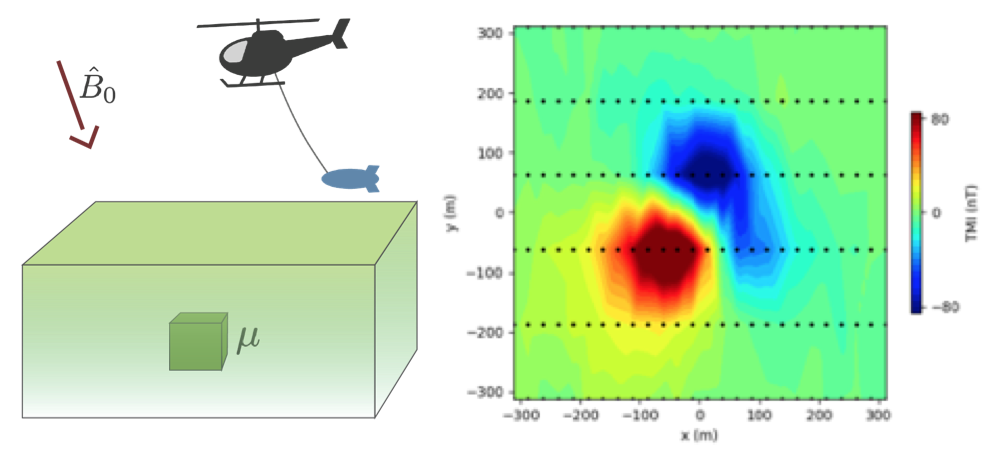
Figure 6:Magnetics
The above examples illustrate the relationship between earth physical property models, a geophysical experiment, and the resulting data. In each of these, the data on the right hand side of the figures, are generated by carrying out a forward simulation of the geophysical experiment. This is a well posed problem with a unique answer. In practise however, we are provided with the data and the ability to forward model and our goal is obtain the model on the left. This is the goal of the inverse problem.